Using the Debugger - The Basics
Before getting into tips and tricks you can use in the Visual Studio debugger, let's cover the basics of using the debugger in the first place. When you've written a piece of code and you would like to see the code in action, you can use the debugger to look at your code. This article will look at how to use the debugger in an ASP.NET web page.
Setting a Start Page
Since we are using an ASP.NET web application, you will need to ensure you have a start page set before attempting to debug. For this example we will use Default.aspx. Right click your start page in the Solution Explorer and select "Set as Start Page".
Ready to Debug
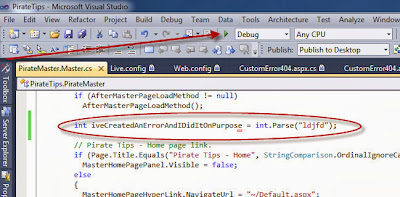
Believe it or not, with those few instructions you are now ready to launch your debugger. With what we've done so far, the debugger will only stop on an error such as the one we've purposefully added to our code for this example. It is circled below. To launch the debugger, click the "Green Play Button" on your Visual Studio toolbar.
Your browser will now launch attempting to display your start page.
Checking Out Your Error
As I've already mentioned, there is an error our debugger will hit. You of course don't have to put errors in your code on purpose, as a matter of fact I recommend against it. This error was added to show you that Visual Studio will stop on errors it finds while debugging as the screenshot below proves.
Escape Plan
To break out of Debug Mode just click the "Blue Stop Button" on your Visual Studio toolbar shown in the image above.


No comments:
Post a Comment